チュートリアル:リアルタイムで信号の周波数を可視化
DSPモジュールのFFTクラスを使用して、入力オーディオデータをスペクトラムアナライザーとして表示する方法を学びます。ウィンドウ関数を使用する利点を理解します。
レベル: 中級
プラットフォーム: Windows, macOS, Linux
クラス: dsp::FFT, dsp::WindowingFunction, Decibels
はじめに
このチュートリアルはチュートリアル:高速フーリエ変換からの続きです。まだ読んでいない場合は、まずそのチュートリアルを読んでください。
このチュートリアルのデモプロジェクトをこちらからダウンロードしてください:PIP | ZIP。プロジェクトを解凍し、最初のヘッダファイルをProjucerで開いてください。
お使いのオペレーティングシステムがマイクへのアクセス許可を要求する場合(現在iOS、Android、macOS Mojave)、Projucerで関連するエクスポーターの下の対応するオプションを設定し、プロジェクトを再保存する必要があります。
この手順でサポートが必要な場合は、チュートリアル:Projucer Part 1: Projucerを始めようを参照してください。
デモプロジェクト
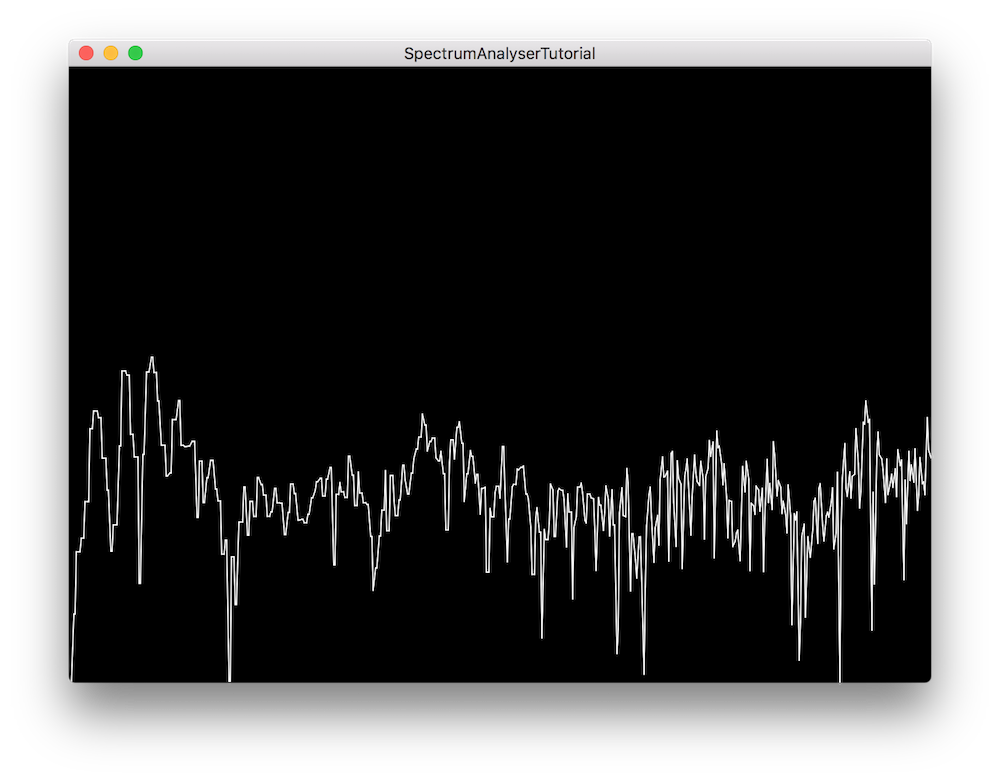
完成すると、デモプロジェクトは入力オーディオデータを周波数(x軸)と振幅(y軸)のドメインで2次元スペクトラムアナライザーとして表示します。画面に表示される値は毎秒30回更新され、任意の時間フレームでのウィンドウは次のようになります:

ウィンドウ関数
チュートリアル:高速フーリエ変換で見たように、高速フーリエ変換を使用すると、時間ドメインの信号を周波数ドメインに変換して、特定の信号の個々の周波数成分を処理できます。
しかし、フーリエ変換の制限として、オーディオアプリケーションのオーディオバッファブロックのような有限の時間間隔で適用されると、変換はスペクトル漏れと呼ばれるものを示し、問題の周波数の両側に新しい周波数成分が現れ始めます。これは、サンプリングされた信号の部分が波形の自然な周期に着地しない可能性があり、本質的に信号を切り捨てるためです。
スペクトル漏れは、類似した周波数と類似した振幅を持つ2つのサイン波、および異なる周波数と異なる振幅を持つ2つのサイン波を分析するときに特に問題になります。サイン波が近い周波数と振幅を持つ場合、漏れによりそれらが互いに区別できなくなる可能性があります。一方、サイン波が遠い周波数と振幅を持つ場合、最も強い成分からの漏れが最も弱い成分の存在を隠す可能性があります。
スペクトル漏れの影響を軽減するために、フーリエ変換を実行する前に信号にウィンドウ関数を適用でき、ウィンドウのタイプによって出力への影響が異なります。以下は、JUCE DSPモジュールで利用可能ないくつかのウィンドウとその特性です:
- Rectangular:最低のダイナミックレンジ、最高の解像度。ウィンドウなしと同等。
- Hamming:適度なダイナミックレンジ、良好な解像度。通常、狭帯域アプリケーションで使用されます。
- Hann:良好なダイナミックレンジ、適度な解像度。通常、狭帯域アプリケーションで使用されます。
- Blackman:最高のダイナミックレンジ、最低の解像度。通常、広帯域アプリケーションで使用されます。
オーディオデータの処理
現在、アプリケーションは入力オーディオ信号を表示も処理もしていないので、FFTの実装から始めましょう。
FFTの初期化
AnalyserComponentクラスで、FFT実装に役立つ定数を定義するパブリックメンバーとしてenumを宣言することから始めます:
enum {
    fftOrder = 11, // [1]
    fftSize = 1 << fftOrder, // [2]
    scopeSize = 512 // [3]
};
- [1]:FFTオーダーはFFTウィンドウのサイズを指定し、操作するポイント数はオーダーの2乗に対応します。この場合、オーダー11を使用すると、2 ^ 11 = 2048ポイントのFFTが生成されます。
- [2]:対応するFFTサイズを計算するには、バイナリ数100000000000として2048を生成する左ビットシフト演算子を使用します。
- [3]:また、スペクトラムの視覚的表現のポイント数をスコープサイズ512として設定します。
次に、以下に示すようにFFT実装に必要なプライベートメンバー変数を宣言します:
private:
    juce::dsp::FFT forwardFFT; // [4]
    juce::dsp::WindowingFunction<float> window; // [5]

    float fifo[fftSize]; // [6]
    float fftData[2 * fftSize]; // [7]
    int fifoIndex = 0; // [8]
    bool nextFFTBlockReady = false; // [9]
    float scopeData[scopeSize]; // [10]

    JUCE_DECLARE_NON_COPYABLE_WITH_LEAK_DETECTOR (AnalyserComponent)
};
- [4]:順方向FFTを実行するためのdsp::FFTオブジェクトを宣言します。
- [5]:また、信号にウィンドウ関数を適用するためのdsp::WindowingFunctionオブジェクトを宣言します。
- [6]:サイズ2048のfifo float配列には、サンプル単位の入力オーディオデータが含まれます。
- [7]:サイズ4096のfftData float配列には、FFT計算の結果が含まれます。
- [8]:この一時インデックスは、fifo内のサンプル数をカウントします。
- [9]:この一時ブール値は、次のFFTブロックがレンダリング準備ができているかどうかを示します。
- [10]:サイズ512のscopeData float配列には、画面に表示するポイントが含まれます。
では、コンストラクタのメンバー初期化リストでこれらの変数を初期化しましょう:
AnalyserComponent()
    : forwardFFT (fftOrder),
      window (fftSize, juce::dsp::WindowingFunction<float>::hann)
{
FFTオブジェクトは、この時点で正しいオーダーで明示的に初期化する必要があり、ウィンドウ関数を選択できます。この場合、Hann関数を使用することを決定しましたが、別のものを自由に選択してください。
オーバーライドされたgetNextAudioBlock()関数では、現在のオーディオバッファブロックに含まれるすべてのサンプルをfifoにプッシュして、後で処理します:
void getNextAudioBlock (const juce::AudioSourceChannelInfo& bufferToFill) override
{
    if (bufferToFill.buffer->getNumChannels() > 0)
    {
        auto* channelData = bufferToFill.buffer->getReadPointer (0, bufferToFill.startSample);

        for (auto i = 0; i < bufferToFill.numSamples; ++i)
            pushNextSampleIntoFifo (channelData[i]);
    }
}
サンプルをfifoにプッシュするには、以下に説明するようにpushNextSampleIntoFifo()関数を実装します:
void pushNextSampleIntoFifo (float sample) noexcept
{
    // if the fifo contains enough data, set a flag to say
    // that the next frame should now be rendered..
    if (fifoIndex == fftSize) // [11]
    {
        if (!nextFFTBlockReady) // [12]
        {
            juce::zeromem (fftData, sizeof (fftData));
            memcpy (fftData, fifo, sizeof (fifo));
            nextFFTBlockReady = true;
        }

        fifoIndex = 0;
    }

    fifo[fifoIndex++] = sample; // [12]
}
- [11]:fifoに十分なデータが含まれている場合(この場合2048サンプル)、FFTによって処理されるためにデータをfftData配列にコピーする準備ができています。また、次のフレームがレンダリングされるべきであることを示すフラグを設定し、fifoを再び満たし始めるために常にインデックスを0にリセットします。
- [12]:この関数が呼び出されるたびに、サンプルがfifoに格納され、インデックスがインクリメントされます。
fifoデータはFFT入力配列の前半を占め、処理および表示の準備ができています。
アナライザーの表示
drawNextFrameOfSpectrum()関数で、以下に説明するようにフレーム描画の実装を挿入します:
void drawNextFrameOfSpectrum()
{
    // first apply a windowing function to our data
    window.multiplyWithWindowingTable (fftData, fftSize); // [1]

    // then render our FFT data..
    forwardFFT.performFrequencyOnlyForwardTransform (fftData); // [2]

    auto mindB = -100.0f;
    auto maxdB = 0.0f;

    for (int i = 0; i < scopeSize; ++i) // [3]
    {
        auto skewedProportionX = 1.0f - std::exp (std::log (1.0f - (float) i / (float) scopeSize) * 0.2f);
        auto fftDataIndex = juce::jlimit (0, fftSize / 2, (int) (skewedProportionX * (float) fftSize * 0.5f));
        auto level = juce::jmap (juce::jlimit (mindB, maxdB, juce::Decibels::gainToDecibels (fftData[fftDataIndex]) - juce::Decibels::gainToDecibels ((float) fftSize)),
            mindB,
            maxdB,
            0.0f,
            1.0f);

        scopeData[i] = level; // [4]
    }
}
- [1]:まず、ウィンドウオブジェクトで
multiplyWithWindowingTable()関数を呼び出し、データを引数として渡すことで、入力データにウィンドウ関数を適用します。 - [2]:次に、fftData配列を引数としてFFTオブジェクトの
performFrequencyOnlyForwardTransform()関数を使用してFFTデータをレンダリングします。 - [3]:スコープ幅の各ポイントに対するforループで、目的の最小および最大デシベルに比例したレベルを計算します。これを行うには、まずx軸を歪ませて対数スケールを使用し、周波数をより適切に表現する必要があります。次に、このスケーリング係数を使用して正しい配列インデックスを取得し、振幅値を使用して
0.0 .. 1.0の範囲にマッピングできます。 - [4]:最後に、描画プロセスを準備するために適切なポイントを正しい振幅で設定します。
タイマーコールバック関数を使用してアナライザーを更新します。次のFFTブロックが準備できている場合にのみdrawNextFrameOfSpectrum()を呼び出し、フラグをリセットし、repaint()関数を使用してGUIを更新します:
void timerCallback() override
{
    if (nextFFTBlockReady)
    {
        drawNextFrameOfSpectrum();
        nextFFTBlockReady = false;
        repaint();
    }
}
最後のステップとして、paint()コールバックはrepaint()リクエストが開始されるたびにヘルパー関数drawFrame()を呼び出し、フレームは以下のように描画できます:
void drawFrame (juce::Graphics& g)
{
    for (int i = 1; i < scopeSize; ++i)
    {
        auto width = getLocalBounds().getWidth();
        auto height = getLocalBounds().getHeight();

        g.drawLine ({ (float) juce::jmap (i - 1, 0, scopeSize - 1, 0, width),
            juce::jmap (scopeData[i - 1], 0.0f, 1.0f, (float) height, 0.0f),
            (float) juce::jmap (i, 0, scopeSize - 1, 0, width),
            juce::jmap (scopeData[i], 0.0f, 1.0f, (float) height, 0.0f) });
    }
}
ここでは、最初のポイントを除く配列内のすべてのポイントに対して、スコープのサイズを画面境界のサイズにマッピングすることで、前のポイントと現在のポイントの間に線を描画します。
演習:FFTで使用されるウィンドウ関数を変更し、スペクトラムアナライザーがどのように異なる反応をするか注意してください。
このコードの修正版のソースコードは、デモプロジェクトのSpectrumAnalyserTutorial_02.hファイルにあります。
まとめ
このチュートリアルでは、ウィンドウ関数とFFTを使用してオーディオデータをスペクトラムアナライザーに表示する方法を学びました。特に以下のことを行いました:
- ウィンドウ関数の基本を学びました。
- fifoを使用してサンプルごとにオーディオを処理しました。
- サンプルポイント間に線を描画してデータを表示しました。