チュートリアル:高速フーリエ変換
DSPモジュールのFFTクラスを使用して、入力オーディオデータをスペクトログラムとして表示する方法を学びます。高速フーリエ変換を使用する利点を理解します。
レベル: 中級
プラットフォーム: Windows, macOS, Linux
クラス: dsp::FFT, Image, Colour, FloatVectorOperations
はじめに
このチュートリアルのデモプロジェクトをこちらからダウンロードしてください:PIP | ZIP。プロジェクトを解凍し、最初のヘッダファイルをProjucerで開いてください。
お使いのオペレーティングシステムがマイクへのアクセス許可を要求する場合(現在iOS、Android、macOS Mojave)、Projucerで関連するエクスポーターの下の対応するオプションを設定し、プロジェクトを再保存する必要があります。
この手順でサポートが必要な場合は、チュートリアル:Projucer Part 1: Projucerを始めようを参照してください。
デモプロジェクト
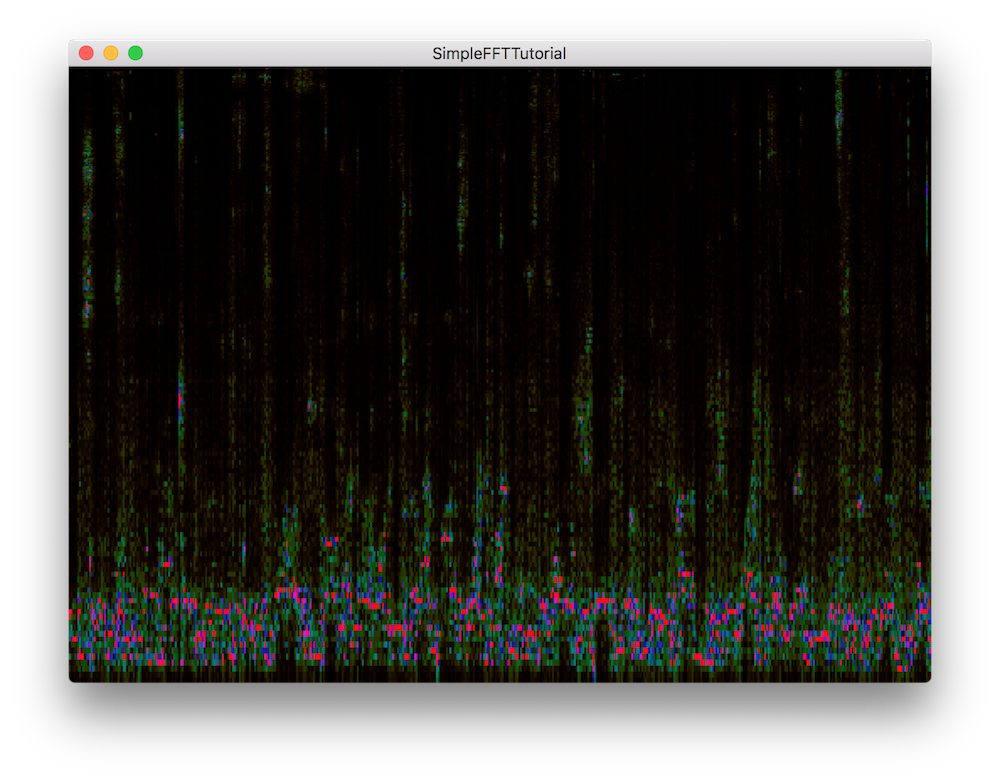
完成すると、デモプロジェクトは入力オーディオデータを時間(x軸)、周波数(y軸)、振幅(色)のドメインで3次元スペクトログラムとして表示します。画面に表示される値は毎秒60回更新され、任意の時間フレームでのウィンドウは次のようになります:

ここで紹介するコードは、JUCEサンプルのSimpleFFTExampleとほぼ同様です。
高速フーリエ変換
時間または空間ドメインの信号は、フーリエ変換と呼ばれる変換式を使用して周波数ドメインに変換できます。この変換関数の一般的な効率的な実装は、高速フーリエ変換またはFFTであり、これはJUCE DSPモジュールに含まれており、このチュートリアルで使用します。
FFTを使用すると、オーディオ信号をその周波数に分解し、これらの各周波数の大きさと位相情報を表現できます。逆関数を使用すると、信号を元のドメインに戻すことができるため、フィルタリングなどの個々の周波数成分を処理するのに非常に便利です。
このチュートリアルでは、出力のための実際の処理なしでオーディオデータの表示のみを扱うため、逆FFTではなく順方向FFTに焦点を当てます。
オーディオデータの処理
現在、アプリケーションは入力オーディオ信号を表示も処理もしていないので、FFTの実装から始めましょう。
FFTの初期化
SpectrogramComponentクラスで、FFT実装に役立ついくつかの定数を定義することから始めます:
static constexpr auto fftOrder = 10; // [1]
static constexpr auto fftSize = 1 << fftOrder; // [2]

private:
- [1]:FFTオーダーはFFTウィンドウのサイズを指定し、操作するポイント数はオーダーの2乗に対応します。この場合、オーダー10を使用すると、2 ^ 10 = 1024ポイントのFFTが生成されます。
- [2]:対応するFFTサイズを計算するには、バイナリ数10000000000として1024を生成する左ビットシフト演算子を使用します。
次に、以下に示すようにFFT実装に必要なプライベートメンバー変数を宣言します:
juce::dsp::FFT forwardFFT; // [3]
juce::Image spectrogramImage;

std::array<float, fftSize> fifo; // [4]
std::array<float, fftSize * 2> fftData; // [5]
int fifoIndex = 0; // [6]
bool nextFFTBlockReady = false; // [7]

JUCE_DECLARE_NON_COPYABLE_WITH_LEAK_DETECTOR (SpectrogramComponent)
};
- [3]:順方向FFTを実行するためのdsp::FFTオブジェクトを宣言します。
- [4]:サイズ1024のfifo float配列には、サンプル単位の入力オーディオデータが含まれます。
- [5]:サイズ2048のfftData float配列には、FFT計算の結果が含まれます。
- [6]:この一時インデックスは、fifo内のサンプル数をカウントします。
- [7]:この一時ブール値は、次のFFTブロックがレンダリング準備ができているかどうかを示します。
では、コンストラクタのメンバー初期化リストでこれらの変数を初期化しましょう:
SpectrogramComponent()
    : forwardFFT (fftOrder),
      spectrogramImage (juce::Image::RGB, 512, 512, true)
{
FFTオブジェクトは、この時点で正しいオーダーで明示的に初期化する必要があります。
オーバーライドされたgetNextAudioBlock()関数では、現在のオーディオバッファブロックに含まれるすべてのサンプルをfifoにプッシュして、後で処理します:
void getNextAudioBlock (const juce::AudioSourceChannelInfo& bufferToFill) override
{
    if (bufferToFill.buffer->getNumChannels() > 0)
    {
        auto* channelData = bufferToFill.buffer->getReadPointer (0, bufferToFill.startSample);

        for (auto i = 0; i < bufferToFill.numSamples; ++i)
            pushNextSampleIntoFifo (channelData[i]);
    }
}
サンプルをfifoにプッシュするには、以下に説明するようにpushNextSampleIntoFifo()関数を実装します:
void pushNextSampleIntoFifo (float sample) noexcept
{
    // if the fifo contains enough data, set a flag to say
    // that the next line should now be rendered..
    if (fifoIndex == fftSize) // [8]
    {
        if (!nextFFTBlockReady) // [9]
        {
            std::fill (fftData.begin(), fftData.end(), 0.0f);
            std::copy (fifo.begin(), fifo.end(), fftData.begin());
            nextFFTBlockReady = true;
        }

        fifoIndex = 0;
    }

    fifo[(size_t) fifoIndex++] = sample; // [9]
}
- [8]:fifoに十分なデータが含まれている場合(この場合1024サンプル)、FFTによって処理されるためにデータをfftData配列にコピーする準備ができています。また、次の行がレンダリングされるべきであることを示すフラグを設定し、fifoを再び満たし始めるために常にインデックスを0にリセットします。
- [9]:この関数が呼び出されるたびに、サンプルがfifoに格納され、インデックスがインクリメントされます。
fifoデータはFFT入力配列の前半を占め、処理および表示の準備ができています。
スペクトログラムの表示
drawNextLineOfSpectrogram()関数で、以下に説明するようにピクセル描画の実装を挿入します:
void drawNextLineOfSpectrogram()
{
    auto rightHandEdge = spectrogramImage.getWidth() - 1;
    auto imageHeight = spectrogramImage.getHeight();

    // first, shuffle our image leftwards by 1 pixel..
    spectrogramImage.moveImageSection (0, 0, 1, 0, rightHandEdge, imageHeight); // [1]

    // then render our FFT data..
    forwardFFT.performFrequencyOnlyForwardTransform (fftData.data()); // [2]

    // find the range of values produced, so we can scale our rendering to
    // show up the detail clearly
    auto maxLevel = juce::FloatVectorOperations::findMinAndMax (fftData.data(), fftSize / 2); // [3]

    juce::Image::BitmapData bitmap { spectrogramImage, rightHandEdge, 0, 1, imageHeight, juce::Image::BitmapData::writeOnly }; // [4]

    for (auto y = 1; y < imageHeight; ++y) // [5]
    {
        auto skewedProportionY = 1.0f - std::exp (std::log ((float) y / (float) imageHeight) * 0.2f);
        auto fftDataIndex = (size_t) juce::jlimit (0, fftSize / 2, (int) (skewedProportionY * fftSize / 2));
        auto level = juce::jmap (fftData[fftDataIndex], 0.0f, juce::jmax (maxLevel.getEnd(), 1e-5f), 0.0f, 1.0f);

        bitmap.setPixelColour (0, y, juce::Colour::fromHSV (level, 1.0f, level, 1.0f)); // [6]
    }
}
- [1]:まず、Imageオブジェクトの
moveImageSection()関数を使用して、画像を1ピクセル左にシャッフルします。画像セクションを全幅マイナス1ピクセルと全高として指定します。 - [2]:次に、fftData配列を引数としてFFTオブジェクトの
performFrequencyOnlyForwardTransform()関数を使用してFFTデータをレンダリングします。 - [3]:生成された値の範囲を見つけて、詳細が明確に表示されるようにレンダリングをスケーリングできるようにします。FloatVectorOperations::findMinAndMax()関数を使用してこれを行うことができます。
- [4]:スペクトログラム画像の右端のピクセル列を参照するBitmapDataインスタンスを作成します。画像内の複数のピクセルを読み書きする場合、BitmapDataインスタンスを使用してピクセル値を内部的にバッファリングし、一度に読み書きできます。このアプローチは通常、Imageのメンバー関数を使用して個々のピクセルにアクセスするよりも高速です。
- [5]:スペクトログラムの高さの各ピクセルに対するforループで、サンプルセットに比例したレベルを計算します。これを行うには、まずy軸を歪ませて対数スケールを使用し、周波数をより適切に表現する必要があります。次に、このスケーリング係数を使用して正しい配列インデックスを取得し、振幅値を使用して
0.0 .. 1.0の範囲にマッピングできます。 - [6]:最後に、FFTデータを表示するために適切なピクセルを正しい色で設定します。
最後のステップとして、タイマーコールバック関数を使用してスペクトログラムを更新します。次のFFTブロックが準備できている場合にのみdrawNextLineOfSpectrogram()を呼び出し、フラグをリセットし、repaint()関数を使用してGUIを更新します:
void timerCallback() override
{
    if (nextFFTBlockReady)
    {
        drawNextLineOfSpectrogram();
        nextFFTBlockReady = false;
        repaint();
    }
}
演習:FFTの解像度を上げて、スペクトログラムが更新されるレートを変更してみてください。
このコードの修正版のソースコードは、デモプロジェクトのSimpleFFTTutorial_02.hファイルにあります。
まとめ
このチュートリアルでは、FFT関数を使用してオーディオデータをスペクトログラムに表示する方法を学びました。特に以下のことを行いました:
- 高速フーリエ変換関数の基本を学びました。
- fifoを使用してサンプルごとにオーディオを処理しました。
- Imageオブジェクトにピクセルごとにデータを表示しました。